Regardless of how a drug's effect occurs—through binding or chemical interaction—the concentration of the drug at the site of action controls the effect. However, response to concentration may be complex and is often nonlinear. The relationship between the drug dose, regardless of route used, and the drug concentration at the cellular level is even more complex (see Pharmacokinetics).
Dose-response data are typically graphed with the dose or dose function (eg, log10 dose) on the x-axis and the measured effect (response) on the y-axis. Because a drug effect is a function of dose and time, such a graph depicts the dose-response relationship independent of time. Measured effects are frequently recorded as maximal at time of peak effect or under steady-state conditions (eg, during continuous IV infusion). Drug effects may be quantified at the level of molecule, cell, tissue, organ, organ system, or organism.
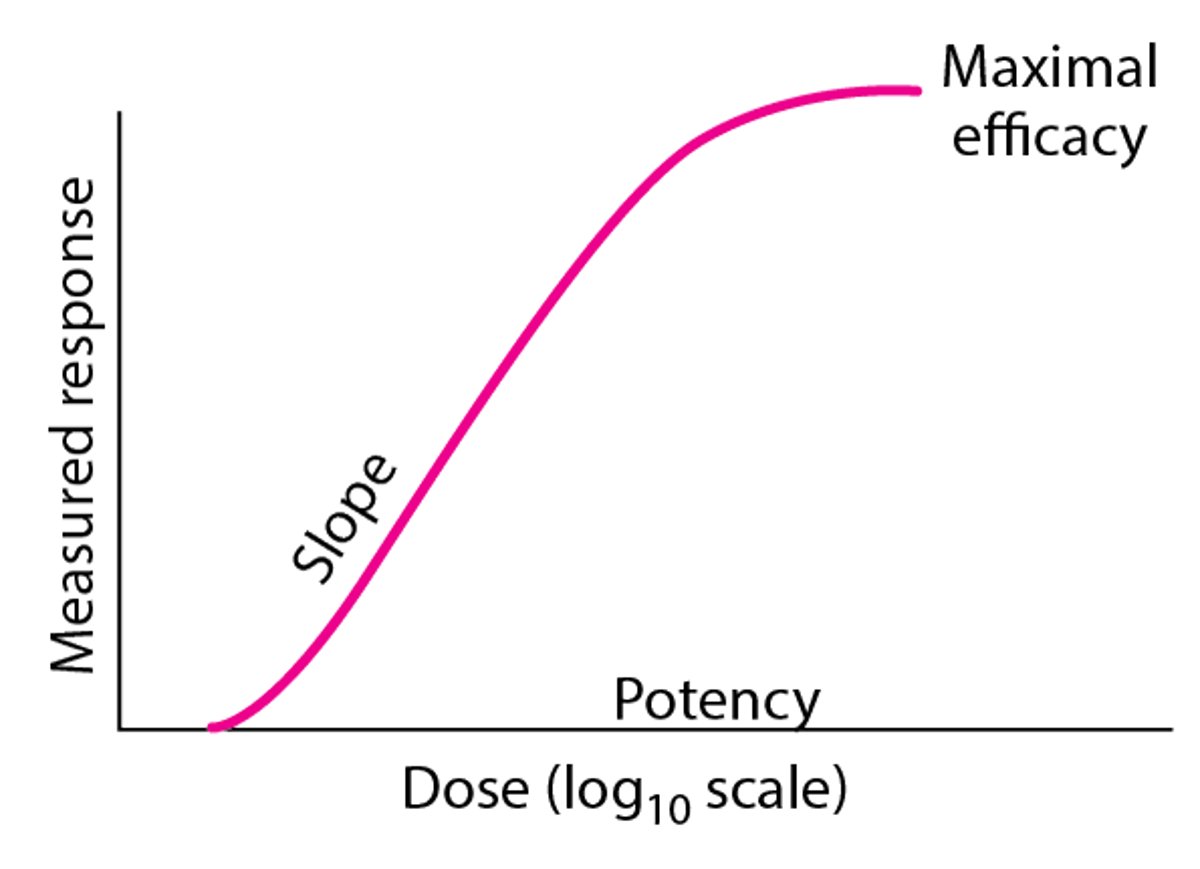
A hypothetical dose-response curve has features that vary (see figure Hypothetical Dose-Response Curve):
Potency (location of curve along the dose axis)
Maximal efficacy or ceiling effect (greatest attainable response)
Slope (change in response per unit dose)
Hypothetical Dose-Response Curve

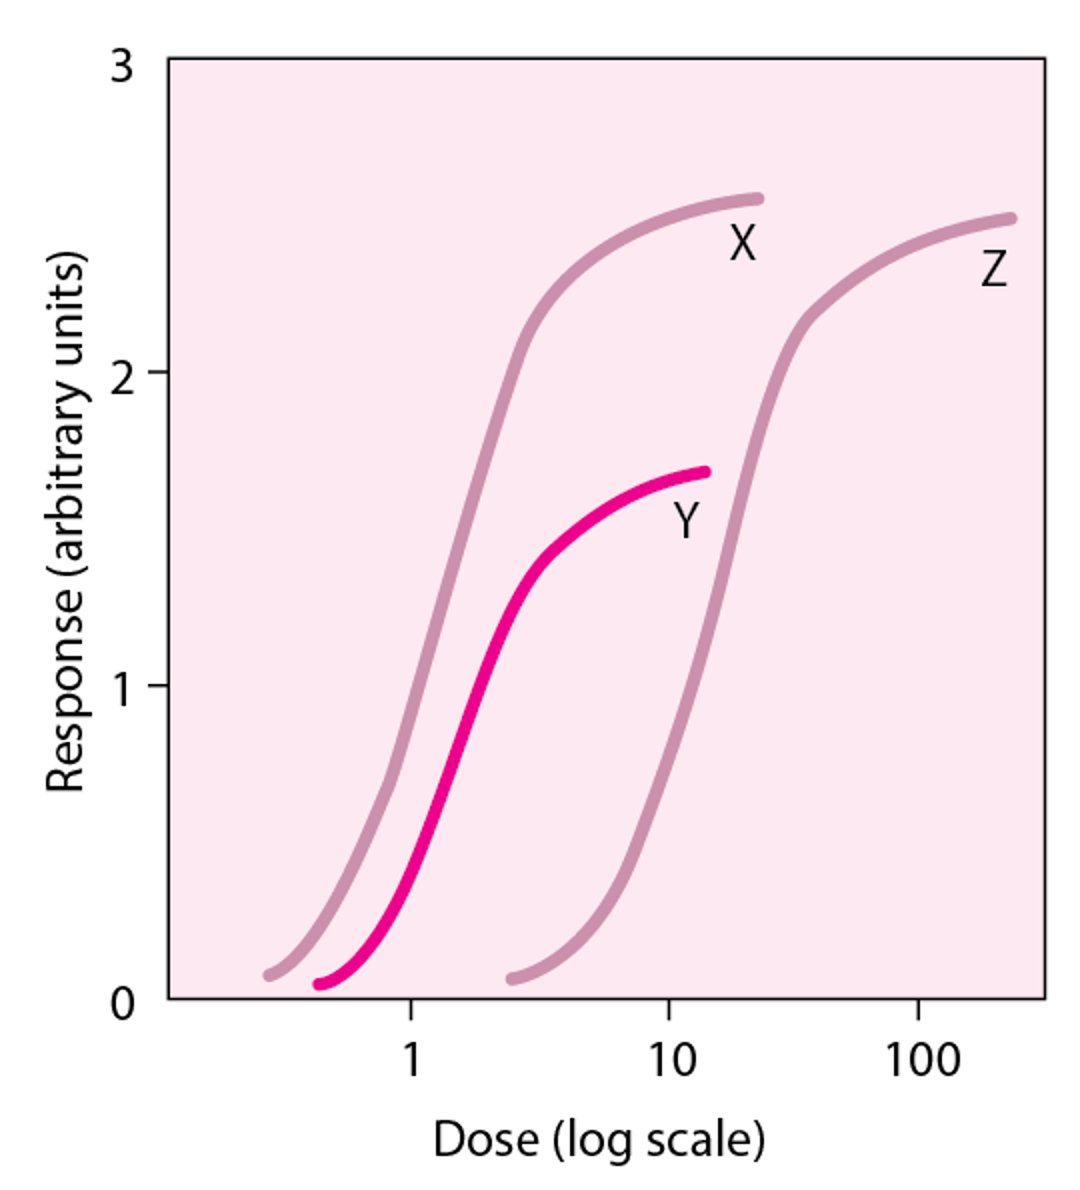
Biologic variation (variation in magnitude of response among test subjects in the same population given the same dose of drug) also occurs. Graphing dose-response curves of drugs studied under identical conditions can help compare the pharmacologic profiles of the drugs (see figure Comparison of Dose-Response Curves for drugs X, Y, and Z ). This information helps determine the dose necessary to achieve the desired effect.
Comparison of Dose-Response Curves for Drugs X, Y, and Z
Drug X has greater biologic activity per dosing equivalent and is thus more potent than drug Y or Z. drugs X and Z have equal efficacy, indicated by their maximal attainable response (ceiling effect). Drug Y is more potent than drug Z, but its maximal efficacy is lower. |

Dose-response, which involves the principles of pharmacokinetics and pharmacodynamics, determines the required dose and frequency as well as the therapeutic index for a drug in a population. The therapeutic index (ratio of the minimum toxic concentration to the median effective concentration) helps determine the efficacy and safety of a drug. Increasing the dose of a drug with a small therapeutic index increases the probability of toxicity and/or ineffectiveness of the drug. However, these features differ by population and are affected by patient-related factors, such as pregnancy, age, and organ function (eg, estimated GFR).