


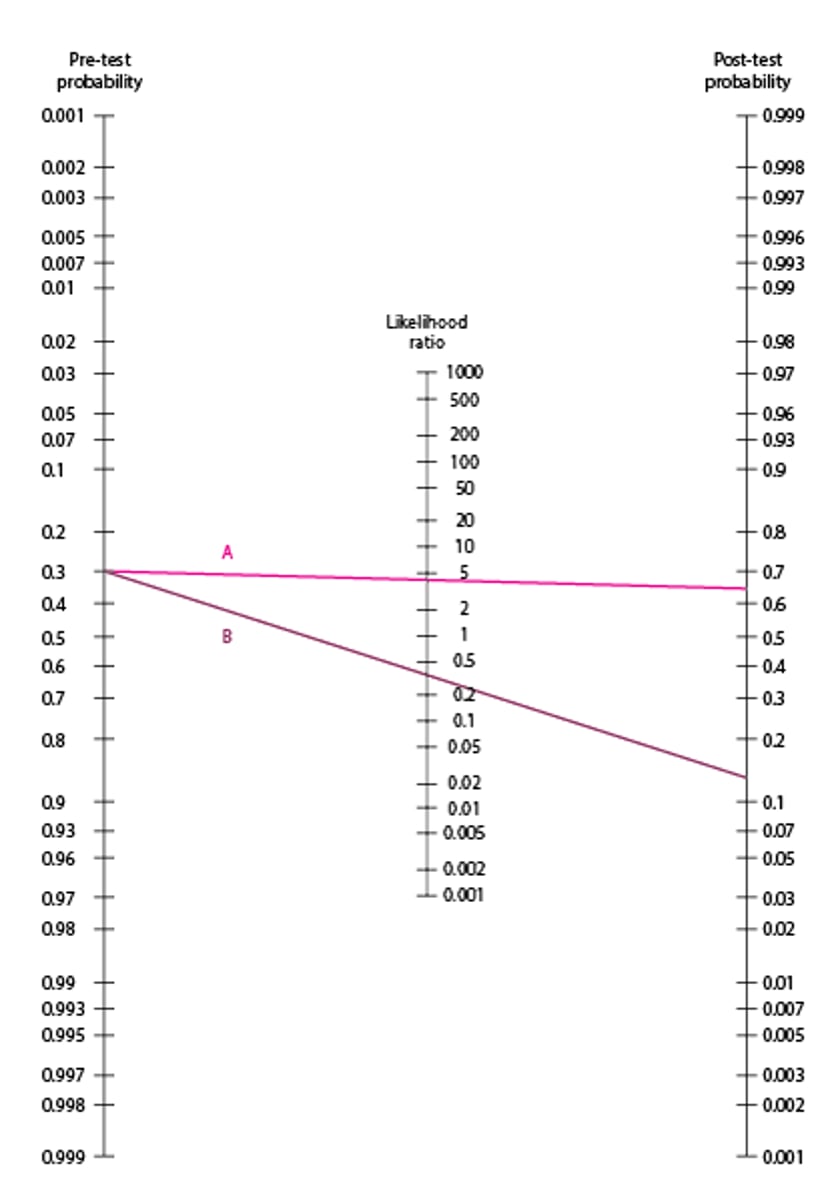
Illustrative lines are drawn using data from the UTI test in the table Distribution of Test Results of a Hypothetical Leukocyte Esterase Test in a Cohort of 1000 Women With an Assumed 30% Prevalence of UTI. Line A represents a positive test result, drawn from a pre-test probability of 0.3 through an LR+ of 4.73 to a post-test value of slightly < 0.7, similar to the calculated probability of 0.67. Line B represents a negative test result drawn from pre-test probability of 0.3 through an LR- of 0.34 to a post-test value slightly > 0.1, similar to the calculated probability of 13%.
LR+ = likelihood ratio for a positive result; LR- = LR for a negative result.
Adapted from Fagan TJ. Letter: Nomogram for Bayes theorem. New England Journal of Medicine 293:257, 1975.