Undernutrition is a form of malnutrition. (Malnutrition also includes overnutrition.) Undernutrition can result from inadequate ingestion of nutrients, malabsorption, impaired metabolism, loss of nutrients due to diarrhea, or increased nutritional requirements (as occurs in periods of rapid growth and increased nutritional needs or in disorders [eg, cancer, infection]). Chronic undernutrition occurs when a long-term deficiency in the intake of calories and essential nutrients is insufficient to meet a person's nutritional requirements. Undernutrition progresses in stages; it may develop slowly when it is due to anorexia or very rapidly, as sometimes occurs when it is due to rapidly progressive cancer-related cachexia. First, nutrient levels in blood and tissues change, followed by intracellular changes in biochemical functions and structure. Ultimately, symptoms and signs appear. Diagnosis is by history, physical examination, body composition analysis, and sometimes laboratory tests (eg, albumin).
Undernutrition is a worldwide problem (1). The United Nations Food and Agriculture Organization (FAO) reported that in 2022 almost 735 million people, or 9.2% of the global population, faced hunger as measured by the prevalence of undernourishment. That was 122 million more people than had been reported in 2019, before the COVID-19 pandemic. The impact of the pandemic varied throughout the world, as did the subsequent rates of economic growth and recovery, which in turn affected rates of undernutrition in different parts of the world. For example, the prevalence of undernutrition in Africa rose from 19.4% in 2021 to 19.7% in 2022, an increase of 11 million people. In contrast, in Asia, the prevalence of undernutrition decreased from 8.8% in 2021 to 8.5% in 2022, a decrease of more than 12 million people.
General reference
1. Food and Agriculture Organization of the United Nations. Food Security and Nutrition Around the World. Accessed September 15, 2025.
Risk Factors for Undernutrition
Undernutrition is caused by social, cultural, and political factors. Poverty remains the leading cause of undernutrition in low-, middle-, and high-income nations. War, civil unrest, overpopulation, unsafe housing conditions, infectious diseases, pandemics, and urbanization can all contribute to undernutrition.
Undernutrition is of special concern at certain times (ie, during infancy, early childhood, adolescence, pregnancy, breastfeeding, and old age) because these conditions involve rapid growth and/or increase the need for nutrients.
Infancy and childhood
Infants and children are particularly susceptible to undernutrition because of their high demand for energy and essential nutrients. According to the World Health Organization (WHO), in 2022, 149 million children < 5 years of age were estimated to be stunted (too short for age) and 45 million were estimated to be wasted (too thin for height [1]). Protein-energy undernutrition (PEU—previously called protein-energy malnutrition) is an important cause of death in neonates and children aged 1 to 4 years (2). Inadequately fed infants and children around the world are also at risk for deficiencies of iron, iodine, folate (folic acid), (folic acid),vitamin A, and zinc (3).
Infants who are exclusively fed breast milk should be given vitamin D supplementation because breast milk typically does not contain sufficient levels of Infants who are exclusively fed breast milk should be given vitamin D supplementation because breast milk typically does not contain sufficient levels ofvitamin D (4); they can also develop vitamin B12 deficiency if the mother follows a vegan diet (5).
During adolescence, nutritional requirements increase because the growth rate accelerates. Anorexia nervosa may affect adolescent girls in particular.
Pregnancy and breastfeeding
Requirements for nutrients increase during pregnancy (to support the metabolic demands of pregnancy and fetal growth) and breastfeeding. Aberrations of diet, including pica (consumption of nonnutritive substances, such as clay and charcoal), may occur during pregnancy. Iron deficiency anemia is the most common cause of anemia during pregnancy (6). Anemia due to folate deficiency is also common among women who have taken oral contraceptives (7). Vitamin D deficiency is common during late pregnancy, predisposing the child to decreased bone mass (8). For women who are pregnant or breastfeeding, clinicians may need to recommend diet plans or dietary supplements, especially if nutritional status is compromised.
Older adults
Older adults are at high risk of undernutrition because their nutritional needs increase but energy requirements typically decrease. This disparity requires consumption of nutrient-dense foods.
Aging—even when disease or dietary deficiency is absent—leads to sarcopenia (progressive loss of lean body mass), starting after age 40. Undernutrition contributes to sarcopenia (9).
Causes of sarcopenia include the following:
Decreased physical activity
Decreased food intake
Increased levels of cytokines (particularly interleukin-6)
Decreased levels of growth hormone and mechano growth factor (insulin-like growth factor-3)
In men, decreasing androgen levels
Basal metabolic rate generally increases in neonates until about age 1 before decreasing and then stabilizing in adulthood (age 20 to 60) (10). After age 60, basal metabolic rate decreases (due mainly to decreased fat-free mass).
Undernutrition in older adults is frequently caused by decreased food intake resulting from a wide range of factors including the following (11, 12):
Reduced receptive relaxation of the stomach’s fundus
Increased release and activity of cholecystokinin (which produces satiation)
Increased leptin (an anorectic hormone produced by fat cells)
Diminished taste and smell, which can decrease eating pleasure but usually decreases food intake only slightly
Depression (a common cause) and other mood disorders
Medication side effects
Occasionally, anorexia nervosa (sometimes called anorexia tardive in older patients) interferes with eating (11). Dental problems limit the ability to chew and subsequently to digest foods. Swallowing difficulties (eg, due to stroke, esophageal candidiasis, or xerostomia) are common. Food insecurity as a result of poverty can also limit access to nutrients.
Institutionalized older patients are also at risk of protein-energy undernutrition (13). They may be confused and may be unable to express hunger or preferences for foods. They may be physically unable to feed themselves. Chewing or swallowing may be very slow, making it tedious for another person to feed them enough food.
Disorders and medical procedures
Diabetes may decrease gastric emptying and decrease absorption (14).
Intestinal resection, and certain other gastrointestinal surgical procedures (eg, gastrointestinal bypass procedures) can also impair absorption of fat-soluble vitamins, vitamin B12, calcium, and iron (15).
Gluten enteropathy, pancreatic insufficiency, or other disorders can result in malabsorption. Decreased absorption possibly contributes to iron deficiency and osteoporosis.
Some chronic illnesses (eg, cancer, advanced HIV infection) can cause anorexia.
Infections, trauma, hyperthyroidism, extensive burns, and prolonged fever increase metabolic demands. Any condition that increases cytokines may be accompanied by muscle loss, lipolysis, low albumin levels, and anorexia.
Vegetarian and vegan diets
People who follow a vegetarian or vegan diet may develop deficiencies of vitamin B12, vitamin B2, niacin, iodine, zinc, calcium, potassium, and selenium (16).
Fad diets
Many fad diets result in vitamin, mineral, and protein deficiencies when specific foods or food groups are not consumed (17).
Medications and nutritional supplements
Many medications (eg, appetite suppressants, digoxin, glucagon-like peptide-1 [GLP-1] receptor agonists) decrease appetite; others impair nutrient absorption or metabolism. Some medications and other substances (eg, stimulants) have catabolic effects. Certain medications can impair absorption of many nutrients; eg, antiseizure medications can impair absorption of vitamins.Many medications (eg, appetite suppressants, digoxin, glucagon-like peptide-1 [GLP-1] receptor agonists) decrease appetite; others impair nutrient absorption or metabolism. Some medications and other substances (eg, stimulants) have catabolic effects. Certain medications can impair absorption of many nutrients; eg, antiseizure medications can impair absorption of vitamins.
Alcohol or substance dependency
Patients with alcohol or substance dependency may neglect their nutritional needs (18). Absorption and metabolism of nutrients may also be impaired. Alcohol use disorder can cause deficiencies of magnesium, zinc, and certain vitamins, including thiamine.can cause deficiencies of magnesium, zinc, and certain vitamins, including thiamine.
Risk factor references
1. World Health Organization (WHO). Infant and young child feeding, 2021. December 20, 2023. Accessed September 15, 2025.
2. Global Burden of Disease Child and Adolescent Health Collaboration, Kassebaum N, Kyu HH, et al. Child and Adolescent Health From 1990 to 2015: Findings From the Global Burden of Diseases, Injuries, and Risk Factors 2015 Study. JAMA Pediatr. 2017;171(6):573-592. doi:10.1001/jamapediatrics.2017.0250
3. Bailey RL, West Jr KP, Black RE. The epidemiology of global micronutrient deficiencies. Ann Nutr Metab. 2015;66(Suppl 2):22-23.
4. Tan ML, Abrams SA, Osborn DA. Vitamin D supplementation for term breastfed infants to prevent vitamin D deficiency and improve bone health. . Vitamin D supplementation for term breastfed infants to prevent vitamin D deficiency and improve bone health.Cochrane Database Syst Rev. 2020;12(12):CD013046. Published 2020 Dec 11. doi:10.1002/14651858.CD013046.pub2
5. Wirthensohn M, Wehrli S, Ljungblad UW, Huemer M. Biochemical, Nutritional, and Clinical Parameters of Vitamin B12 Deficiency in Infants: A Systematic Review and Analysis of 292 Cases Published between 1962 and 2022. Nutrients. 2023;15(23):4960. Published 2023 Nov 29. doi:10.3390/nu15234960
6. James AH. Iron Deficiency Anemia in Pregnancy. Obstet Gynecol. 2021;138(4):663-674. doi:10.1097/AOG.0000000000004559
7. Shere M, Bapat P, Nickel C, et al. Association Between Use of Oral Contraceptives and Folate Status: A Systematic Review and Meta-Analysis. J Obstetric Gynaecol Canada. 2015;37(5):430-438. https://doi.org/10.1002/jbmr.2138
8. Zhu K, Whitehouse A, Hart P, et al. Maternal vitamin D status during pregnancy and bone mass offspring at 20 years of age: A prospective cohort study. . Maternal vitamin D status during pregnancy and bone mass offspring at 20 years of age: A prospective cohort study.J Bone Mineral Res. 2014;29(5):1088-1095. https://doi.org/10.1002/jbmr.2138
9. Beaudart C, Sanchez-Rodriguez D, Locquet M, et al. Malnutrition as a Strong Predictor of the Onset of Sarcopenia. Nutrients. 2019, 11(12), 2883; https://doi.org/10.3390/nu11122883
10. Pontzer H, Yamada Y, Sagayama H, et al. Daily energy expenditure through the human life course. Science. 2021;373(6556):808-812. DOI: 10.1126/science.abe5017
11. Cruz-Jentoft AJ, Volkert D. Malnutrition in Older Adults. N Engl J Med. 2025;392(22):2244-2255. doi:10.1056/NEJMra2412275
12. Morley JE. Decreased food intake with aging. J Gerontol: Series A. 2001;56:81-88. https://doi.org/10.1093/gerona/56.suppl_2.81
13. Volkert D, Beck AM, Cederholm T, et al. ESPEN guideline on clinical nutrition and hydration in geriatrics. Clin Nutr. 2019;38(1):10-47. doi:10.1016/j.clnu.2018.05.024
14. Goyal RK. Gastric Emptying Abnormalities in Diabetes Mellitus. N Engl J Med. 2021;384(18):1742-1751. doi:10.1056/NEJMra2020927
15. Utrilla Fornals A, Costas-Batlle C, Medlin S, et al. Metabolic and Nutritional Issues after Lower Digestive Tract Surgery: The Important Role of the Dietitian in a Multidisciplinary Setting. Nutrients. 2024;16(2):246. Published 2024 Jan 12. doi:10.3390/nu16020246
16. Yannakoulia M, Scarmeas N. Diets. N Engl J Med. 2024;390(22):2098-2106. doi:10.1056/NEJMra2211889
17. Anderson K. Popular fad diets: An evidence-based perspective. Prog Cardiovasc Dis. 2023;77:78-85. doi:10.1016/j.pcad.2023.02.001
18. Jeynes KD, Gibson EL. The importance of nutrition in aiding recovery from substance use disorders: A review. Drug Alcohol Depend. 2017;179:229-239. doi:10.1016/j.drugalcdep.2017.07.006
Symptoms and Signs of Undernutrition
Symptoms vary depending on the cause and type of undernutrition (eg, protein-energy undernutrition, vitamin deficiency).
Evaluation of Undernutrition
Diagnosis of undernutrition is based on results of medical and diet histories, physical examination, body composition analysis, and selected laboratory tests. Explicit consensus criteria have been proposed but are not yet universally adopted (1).
History
History should include questions about
Dietary intake: See Mini Nutritional Assessment (MNA), a nutrition screening and assessment tool that can identify patients age ≥ 65 who are undernourished or at risk of undernutrition (2)
Chronic disease: See the Global Diet Quality Score (GDQS), a quick way to assess the risk of undernutrition and chronic disease in nonpregnant, nonlactating women of reproductive age (3)
Recent changes in weight
Risk factors for undernutrition, including drug and alcohol use
Unintentional loss of ≥ 10% of usual body weight during a 3-month period indicates a high probability of undernutrition (1, 4). Social history should include questions about food security and the patient's ability to shop and cook.
Review of systems should focus on symptoms of nutritional deficiencies (see table ). For example, impaired night vision may indicate vitamin A deficiency.
Symptoms and Signs of Nutritional Deficiency
Area/System | Symptom or Sign | Deficiency |
|---|---|---|
General appearance | Wasting | Energy |
Skin | Rash | Many vitamins, zinc, essential fatty acids |
Rash in sun-exposed areas | Niacin (pellagra) | |
Easy bruising | ||
Hair and nails | Thinning or loss of hair | |
Premature whitening of hair | ||
Spooning (upcurling) of nails | ||
Eyes | Impaired night vision | |
Corneal keratomalacia (corneal drying and clouding) | Vitamin AVitamin A | |
Mouth | Cheilosis and glossitis | Riboflavin, niacin, pyridoxine, iron |
Bleeding gums | Vitamin C, riboflavin | |
Extremities | Edema | Protein |
Neurologic | Paresthesias or numbness in a stocking-glove distribution | Thiamin (beriberi) |
Tetany | ||
Cognitive and sensory deficits | Thiamin, niacin, pyridoxine, , pyridoxine,vitamin B12 | |
Dementia | Thiamin, niacin, vitamin B12 | |
Musculoskeletal | Wasting of muscle | Protein |
Bone deformities (eg, bowlegs, knocked knees, curved spine) | Vitamin D, calcium | |
Bone tenderness | Vitamin D | |
Joint pain or swelling | Vitamin C | |
Gastrointestinal | Diarrhea | Protein, niacin, folate, vitamin B12 |
Diarrhea and dysgeusia | Zinc | |
Dysphagia or odynophagia (due to Plummer-Vinson syndrome) | Iron | |
Endocrine | Thyromegaly |
Physical examination
Physical examination should include
Measurement of height and weight
Inspection of body fat distribution
Anthropometric measurements of lean body mass
Body mass index (BMI = weight[kg]/height[m]2) adjusts weight for height. If BMI is < 18.5, undernutrition should be suspected (5). Although these findings are useful in diagnosing undernutrition and are acceptably sensitive, they lack specificity.

The mid upper arm muscle area estimates lean body mass. This area is derived from the triceps skinfold thickness (TSF) and mid upper arm circumference. Both are measured at the same site, with the patient’s right arm in a relaxed position. The average mid upper arm circumference is about 34.1 cm for men and 31.9 cm for women (6). The formula for calculating the mid upper arm muscle area in cm2 is as follows:

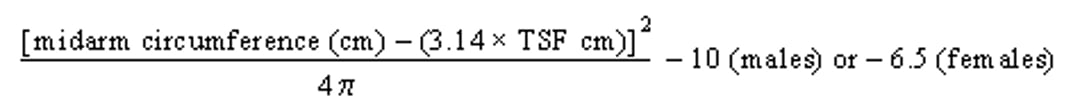
This formula corrects the upper arm area for fat and bone. Average values for the mid upper arm muscle area are 54 ± 11 cm2 for men and 30 ± 7 cm2 for women. A value < 75% of this standard (depending on age) indicates depletion of lean body mass (see table ). This measurement may be affected by physical activity, genetic factors, and age-related muscle loss.
Mid Upper Arm Muscle Area in Adults
Percentage of Standard (%) | Men (cm2) | Women (cm2) | Muscle Mass |
|---|---|---|---|
100 ± 20* | 54 ± 11 | 30 ± 7 | Adequate |
75 | 40 | 22 | Marginal |
60 | 32 | 18 | Depleted |
50 | 27 | 15 | Wasted |
* Mean mid upper arm muscle mass ± 1 standard deviation. | |||
From the National Health and Nutrition Examination Surveys I and II. | |||
Physical examination should focus on signs of specific nutritional deficiencies. Signs of protein-energy undernutrition (eg, edema, muscle wasting, skin changes) should be sought. Examination should also focus on signs of conditions that could predispose to nutritional deficiencies, such as dental problems. Mental status should be assessed because depression and cognitive impairment can lead to weight loss.
The following assessment tools may be useful:
The Malnutrition Screening Tool (MST) is a 2-question screening tool designed to identify malnutrition in hospitalized older patients. A score of 2 or above indicates malnutrition risk while a score of 0 to 1 indicates no risk (7).
The Malnutrition Universal Screening Tool (MUST) was designed by the British Association for Parenteral and Enteral Nutrition. It categorizes patients as at low, medium, or high risk of malnutrition based on their BMI, history of unintentional weight loss, and the likelihood of future weight loss due to acute disease (4).
The widely used Subjective Global Assessment (SGA) uses information from the patient history (eg, weight loss, change in intake, gastrointestinal symptoms), physical examination findings (eg, loss of muscle and subcutaneous fat, edema, ascites), and the clinician’s judgment of the patient’s nutritional status.
The Mini Nutritional Assessment (MNA®) has been validated and is widely used, especially in older patients. The MNA consists of 18 scored questions that are divided into 4 sections: anthropometric measurements, comprehensive assessment, dietary history, and metabolic stress. The possible total score is 30; scores of ≥ 24 indicate normal nutritional status, scores between 17 and 23.5 indicate risk of undernutrition, and scores of < 17 points indicate undernutrition (8–10). The MNA Short Form (MNA-SF) includes only 6 elements and thus is faster and easier to use. A score of ≤ 11 points (out of a total of 14) indicates risk of undernutrition and additional assessments should be performed to confirm diagnosis of undernutrition (11).
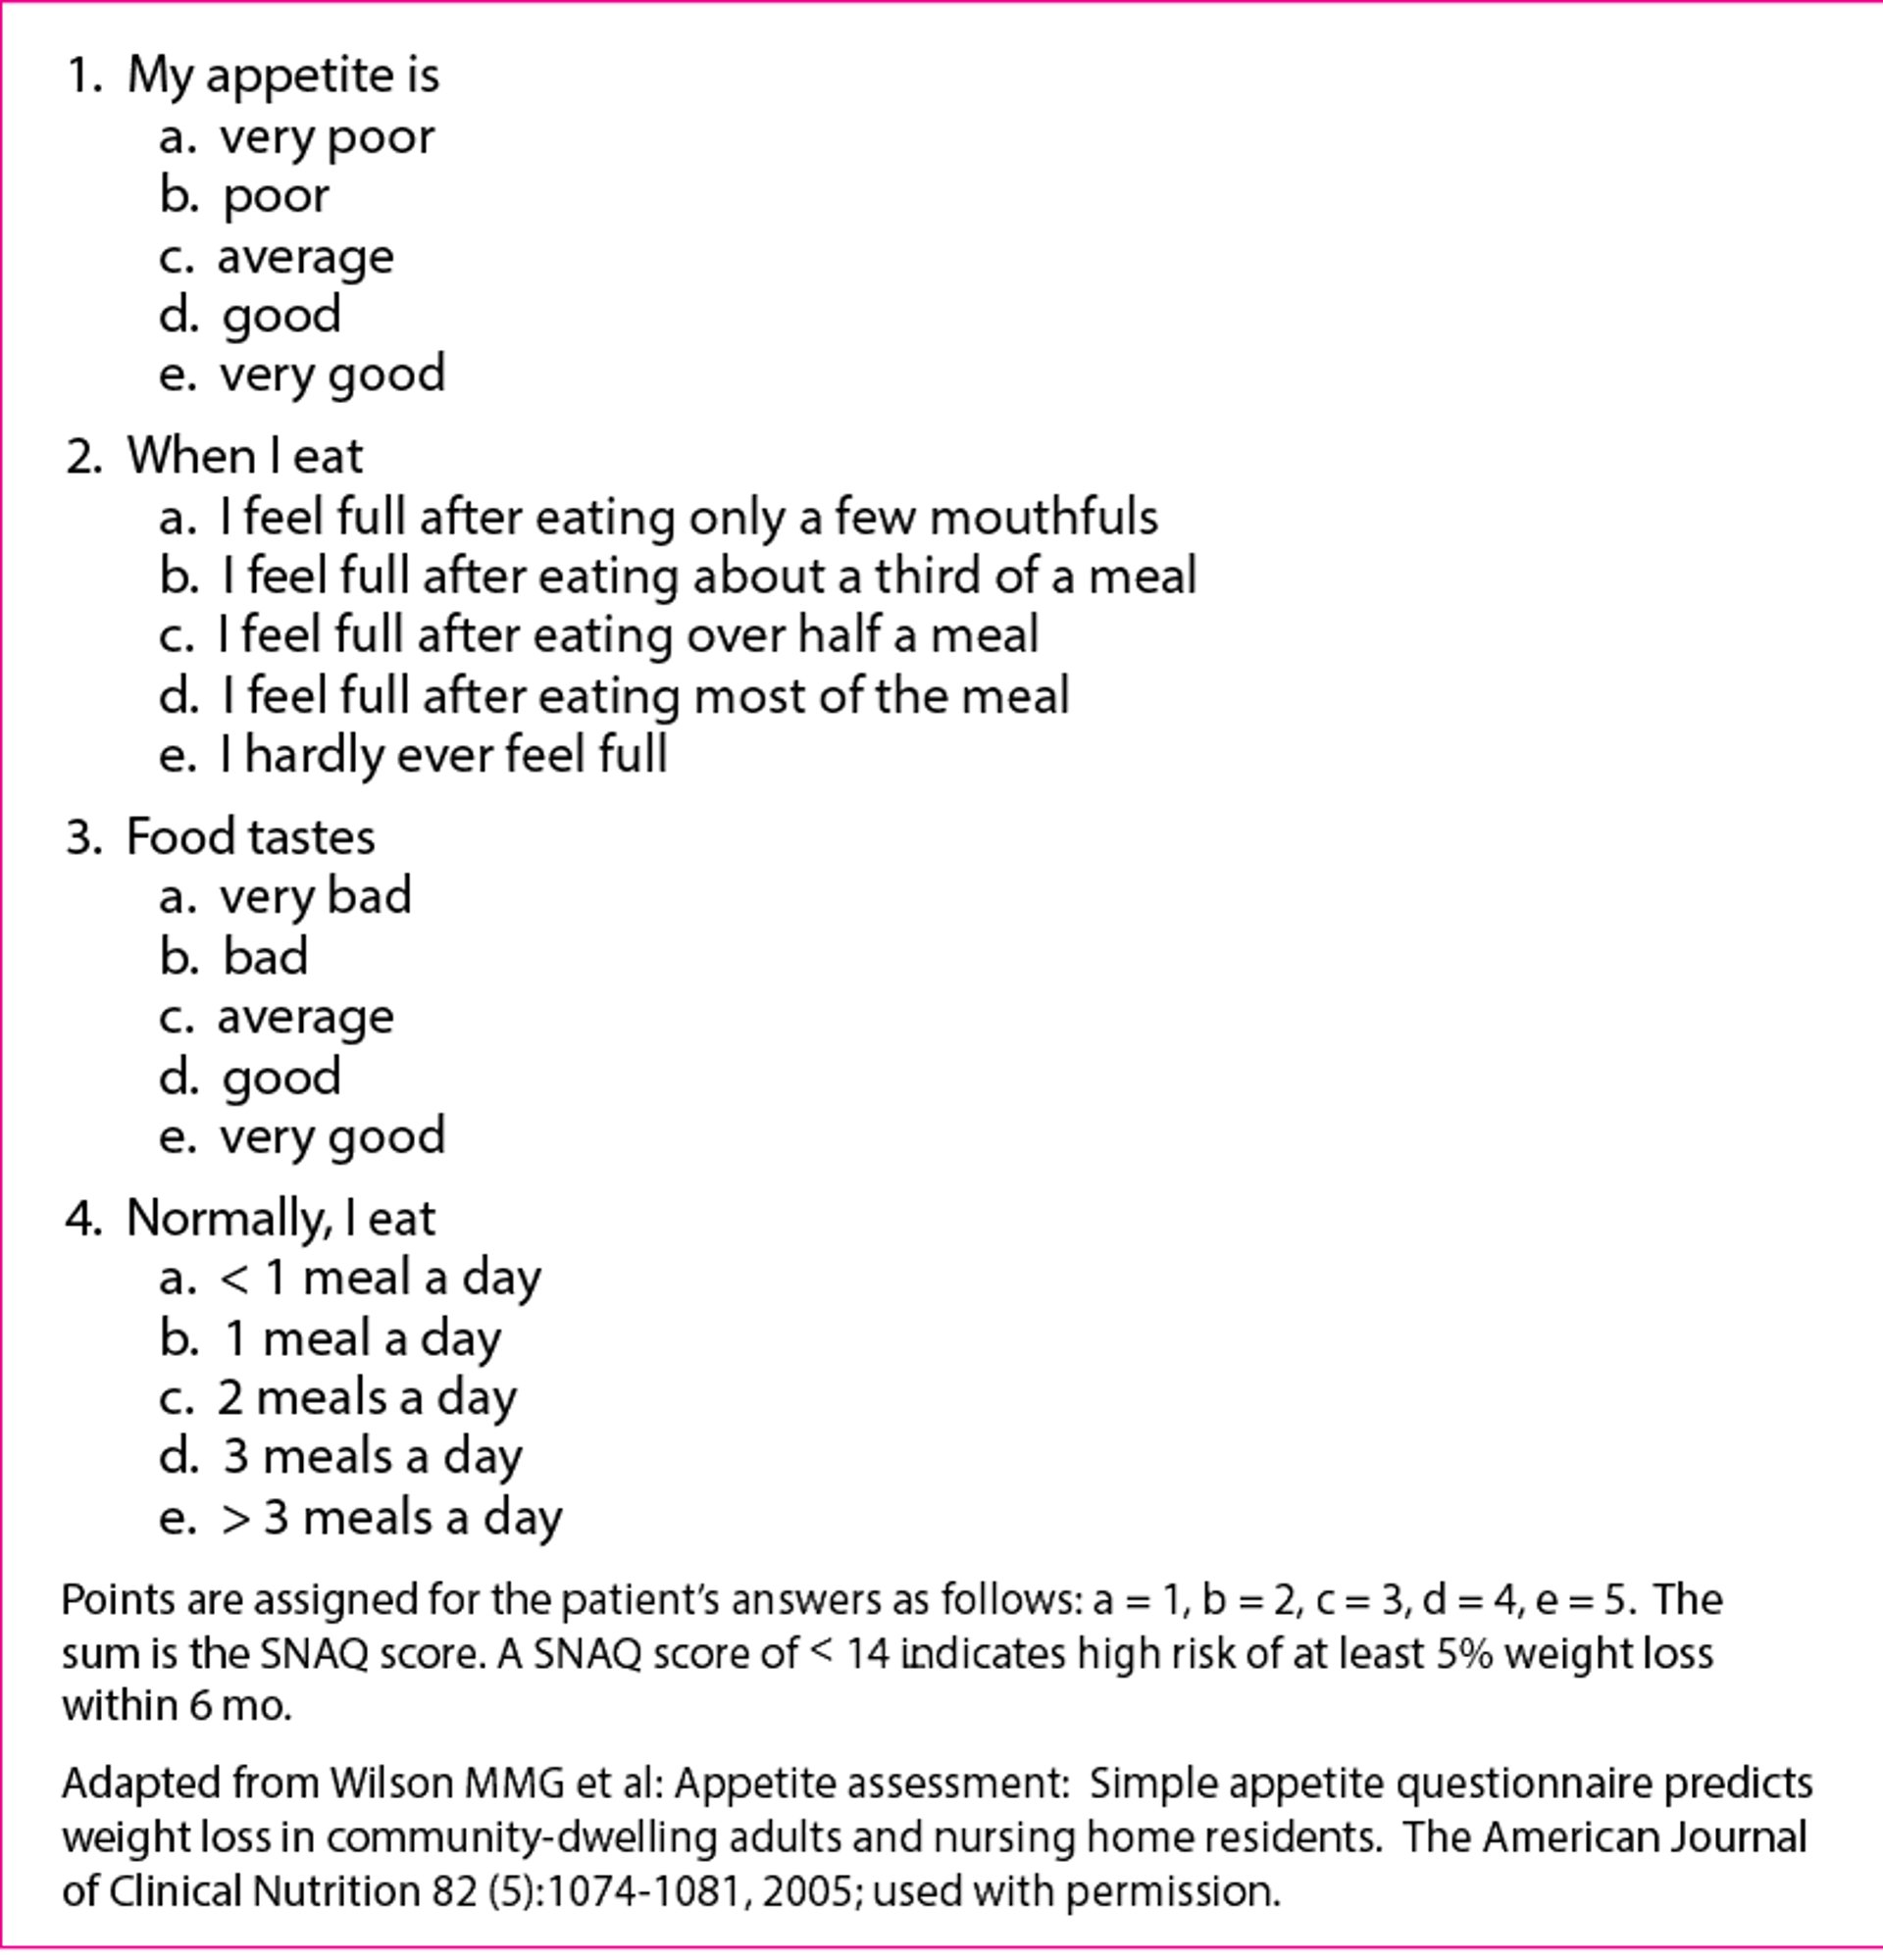
The Simplified Nutrition Assessment Questionnaire (SNAQ), a simple, validated method of predicting future weight loss in community-dwelling older adults, may be used (12).
Simplified Nutrition Assessment Questionnaire (SNAQ)

Testing
The extent of laboratory testing needed is unclear and may depend on the patient’s circumstances. If the cause is obvious and correctable (eg, a wilderness survival situation), testing is probably of little benefit. Other patients may require more detailed evaluation.
Serum albumin measurement is a frequently used laboratory test, even though it has not been shown to be a reliable indicator of nutritional status (13). Decreases in albumin and other proteins (eg, prealbumin [transthyretin], transferrin, retinol-binding protein) may indicate protein deficiency or protein-energy undernutrition (PEU). As undernutrition progresses, albumin decreases slowly; prealbumin, transferrin, and retinol-binding protein decrease rapidly. Albumin measurement is inexpensive and predicts morbidity and mortality better than measurement of the other proteins. However, the correlation of albumin with morbidity and mortality may be related to nonnutritional as well as nutritional factors. Inflammation produces cytokines that cause albumin and other nutritional protein markers to extravasate, decreasing serum levels. Because prealbumin, transferrin, and retinol-binding protein decrease more rapidly during starvation than does albumin, their measurements are sometimes used to diagnose or assess the severity of acute starvation. However, whether they are more sensitive or specific than albumin is unclear.
Urinary creatinine is related to muscle mass. Urinary creatinine excretion over a 24-hour period can be used to compute the creatinine height index (CHI [%]), which reflects lean muscle mass. The CHI is calculated as (24-hour urine creatinine x 100)/ideal creatinine excretion for height (obtained from standard tables). The CHI indicates extent of muscle depletion as follows: > 30% is severe, 15 to 30% is moderate, and 5 to 15% is mild (14).
Other laboratory tests, such as measuring vitamin and mineral levels, are used selectively to diagnose specific deficiencies.
Evaluation references
1. Cederholm T, Jensen GL, Correia MITD, et al. GLIM (Global Leadership Initiative on Malnutrition) criteria for the diagnosis of malnutrition: a consensus report from the global clinical nutrition community. Clin Nutr. 38(1):1–9, 2019. doi: 10.1016/j.clnu.2018.08.002
2. Guigoz Y, Vellas B. Nutritional assessment in older adults: MNA® 25 years of a screening tool and a reference standard for care and research; What next? J Nutr Health Aging. 25(4):528–583, 2021. doi: 10.1007/s12603-021-1601-y
3. Bromage S, Batis C, Bhupathiraju SN, et al. Development and validation of a novel food-based Global Diet Quality Score (GDQS). J Nutr. 151(12 Suppl 2):75S–92S, 2021. doi: 10.1093/jn/nxab244
4. Stratton RJ, Hackston A, Longmore D, et al. Malnutrition in hospital outpatients and inpatients: prevalence, concurrent validity and ease of use of the 'malnutrition universal screening tool' ('MUST') for adults. Br J Nutr. 2004;92(5):799-808. doi:10.1079/bjn20041258
5. Jensen GL, Cederholm T, Correia ITD, et al. GLIM criteria for the diagnosis of malnutrition: A consensus report from the global clinical nutrition community. J Parenteral Enteral Nutr. 2018; Accessed September 16, 2025.
6. Fryar CD, Gu Q, Ogden CL, Flegal KM. Anthropometric reference data for children and adults: United States, 2011–2014. National Center for Health Statistics. Vital Health Stat. 3(39), 2016.
7. Thanh XLT, Thi PD, Thi HL, et al. Validity of NRS-2002, MUST, MST, and MNA-SF as first-step screening tools for malnutrition based on GLIM criteria in older adults. Clin Nutr Open Sci. 2025;63:99-112. doi.org/10.1016/j.nutos.2025.07.008
8. Laporte M, Keller HH, Payette H. et al. Validity and reliability of the new Canadian Nutrition Screening Tool in the ‘real-world’ hospital setting. Eur J Clin Nutr. 69(5):558–564, 2015. doi: 10.1038/ejcn.2014.270 Epub 2014 Dec 17.
9. Kaiser MJ, Bauer JM, Rämsch C, et al. Frequency of malnutrition in older adults: A multinational perspective using the mini nutritional assessment. J Am Geriatr Soc. 58(9):1734–1738, 2010. doi: 10.1111/j.1532-5415.2010.03016.x
10. Guigoz Y. The Mini Nutritional Assessment (MNA) review of the literature—What does it tell us? J Nutr Health Aging. 10(6):466–485; discussion 485–487, 2006.
11. Soysal P, Veronese N, Arik F, et al. Mini Nutritional Assessment Scale-Short Form can be useful for frailty screening in older adults. Clin Interv Aging. 14:693–699, 2019. doi: 10.2147/CIA.S196770 eCollection 2019.
12. Lau S, Pek K, Chew J, et al. The Simplified Nutritional Appetite Questionnaire (SNAQ) as a Screening Tool for Risk of Malnutrition: Optimal Cutoff, Factor Structure, and Validation in Healthy Community-Dwelling Older Adults. Nutrients. 2020;12(9):2885. Published 2020 Sep 21. doi:10.3390/nu12092885
13. Evans DC, Corkins MR, Malone A, et al. The Use of Visceral Proteins as Nutrition Markers: An ASPEN Position Paper. Nutr Clin Pract. 2021;36(1):22-28. doi:10.1002/ncp.10588
14. Hamada Y. Objective data assessment (ODA) methods as nutritional assessment tools. J Med Invest. 62(3–4):119–122, 2015. doi: 10.2152/jmi.62.119
More Information
The following English-language resource may be useful. Please note that The Manual is not responsible for the content of this resource.
Drug Information for the Topic