The standard electrocardiogram (ECG) provides 12 different vector views of the heart’s electrical activity as reflected by electrical potential differences between positive and negative electrodes placed on the limbs and chest wall. Six of these views are in a vertical (coronal) plane using frontal leads I, II, and III and limb leads aVR, aVL, and aVF, and 6 are in a horizontal (axial) plane using precordial leads V1, V2, V3, V4, V5, and V6.
The 12-lead ECG is helpful for establishing many cardiac diagnoses (see table ) and is an important part of a complete cardiovascular evaluation. In some clinical contexts, such as evaluation of structural features such as left ventricular hypertrophy, it has been supplanted by echocardiography and other imaging modalities as the primary mode of diagnosis; however, in others such as arrhythmia diagnosis and the rapid assessment of acute coronary syndromes, it retains critical importance.
Atrial and ventricular enlargement
Ventricular hypertrophy (see table )
Some inherited arrhythmia syndromes (eg, Brugada syndrome, long QT syndrome)
Myocardial ischemia or prior infarction
For more information on ECG interpretation, see Overview of Arrhythmias and ECG in Acute Coronary Syndromes.


RA = right arm; LA = left arm; LL = left leg.
RA = right arm; LA = left arm; LL = left leg.
alfa md/stock.adobe.com


In this image, the positive vector direction is from the negative to the positive electrode.
RA = right arm; LA = left arm; LL = left leg.
In this image, the positive vector direction is from the negative to the positive electrode.
RA = right arm; LA = left
alfa md/stock.adobe.com


In this image, the leads are from a calculated negative electrode to a positive physical electrode. Although the image shows the position of the negative electrode as central, the electrical signal is "augmented" by using the midpoint of the 2 electrodes not used as the positive electrode. For example, the augmented voltage right arm (aVR) lead uses the right arm (RA) electrode as the physical positive electrode and the midpoint of the left arm (LA) and left leg (LL) electrode as the calculated negative electrode.
aVL = augmented voltage left arm; aVF = augmented voltage left foot.
In this image, the leads are from a calculated negative electrode to a positive physical electrode. Although the image
alfa md/stock.adobe.com


The frontal plane system can be divided into 4 quadrants: upper left, lower left, lower right, and upper right. The quadrants describe the position of the vector.
aVR = augmented voltage right arm; aVL = augmented voltage left arm; aVF = augmented voltage left foot.
The frontal plane system can be divided into 4 quadrants: upper left, lower left, lower right, and upper right. The qua
凌鲲 宋/stock.adobe.com

Precordial leads use a calculated negative electrode, which is the midpoint of the 3 physical frontal plane electrodes in roughly the center of the chest. Each lead is named for the physical positive electrode that represents the vector direction from the center.
Precordial leads use a calculated negative electrode, which is the midpoint of the 3 physical frontal plane electrodes
alfa md/stock.adobe.com
RA = right arm; LA = left arm; LL = left leg.
RA = right arm; LA = left arm; LL = left leg.
alfa md/stock.adobe.com
In this image, the positive vector direction is from the negative to the positive electrode.
RA = right arm; LA = left arm; LL = left leg.
In this image, the positive vector direction is from the negative to the positive electrode.
RA = right arm; LA = left
alfa md/stock.adobe.com
In this image, the leads are from a calculated negative electrode to a positive physical electrode. Although the image shows the position of the negative electrode as central, the electrical signal is "augmented" by using the midpoint of the 2 electrodes not used as the positive electrode. For example, the augmented voltage right arm (aVR) lead uses the right arm (RA) electrode as the physical positive electrode and the midpoint of the left arm (LA) and left leg (LL) electrode as the calculated negative electrode.
aVL = augmented voltage left arm; aVF = augmented voltage left foot.
In this image, the leads are from a calculated negative electrode to a positive physical electrode. Although the image
alfa md/stock.adobe.com
The frontal plane system can be divided into 4 quadrants: upper left, lower left, lower right, and upper right. The quadrants describe the position of the vector.
aVR = augmented voltage right arm; aVL = augmented voltage left arm; aVF = augmented voltage left foot.
The frontal plane system can be divided into 4 quadrants: upper left, lower left, lower right, and upper right. The qua
凌鲲 宋/stock.adobe.com
Precordial leads use a calculated negative electrode, which is the midpoint of the 3 physical frontal plane electrodes in roughly the center of the chest. Each lead is named for the physical positive electrode that represents the vector direction from the center.
Precordial leads use a calculated negative electrode, which is the midpoint of the 3 physical frontal plane electrodes
alfa md/stock.adobe.com
Interpretation of Abnormal ECGs
Abnormal Component | Description | Possible Causes |
|---|---|---|
P waves | Abnormal | Left or right atrial enlargement, premature/ectopic atrial complexes, ectopic atrial rhythm, multifocal atrial tachycardia, hyperkalemia |
P waves | Absent | Atrial fibrillation, sinus node arrest or exit block, hyperkalemia (severe) |
P-P interval | Varying | Sinus arrhythmia |
PR interval | Long | |
PR interval | Varying | Mobitz (second-degree) type I (Wenckebach) atrioventricular block, multifocal atrial tachycardia |
P-QRS relationship | Absent | Third-degree atrioventricular block (atrioventricular dissociation) |
QRS complex | Wide | Premature ventricular complexes, right or left bundle branch block or other aberrant conduction ventricular tachycardia, ventricular flutter, ventricular fibrillation, hyperkalemia |
QT interval | Long | Myocardial infarction, myocarditis, stress cardiomyopathy, hypocalcemia, hypokalemia, hypomagnesemia, hypothyroidism, subarachnoid hemorrhage, intracerebral hemorrhage, stroke, congenital long QT syndrome, antiarrhythmics (eg, sotalol, amiodarone, quinidine), tricyclic antidepressants, phenothiazines, other medications |
QT interval | Short | Hypercalcemia, hypermagnesemia, Graves disease, digoxin |
ST segment | Depression | Myocardial ischemia; acute posterior myocardial infarction; digoxin; ventricular hypertrophy; pulmonary embolism; left bundle branch block in leads V5–V6 and possibly in I and aVL; right bundle branch block in leads V1–V3 and possibly in II, III, and aVF; hyperventilation; hypokalemia |
ST segment | Elevation | Myocardial ischemia, acute myocardial infarction, left bundle branch block in leads V1–V3 and possibly in II, III, and aVF, acute pericarditis, left ventricular hypertrophy, hyperkalemia, pulmonary embolism, digoxin, normal variation (eg, athlete's heart), hypothermia |
T wave | Tall | Hyperkalemia, acute myocardial infarction, left bundle branch block, stroke, ventricular hypertrophy |
T wave | Small, flattened, or inverted | Myocardial ischemia, myocarditis, age, race, hyperventilation, anxiety, drinking hot or cold beverages, left ventricular hypertrophy, certain medications (eg, digoxin), pericarditis, pulmonary embolism, conduction disturbances (eg, right bundle branch block), electrolyte disturbances (eg, hypokalemia), stress cardiomyopathy |
U wave | Prominent | Hypokalemia, hypomagnesemia, ischemia |
Criteria for ECG Diagnosis of Left Ventricular Hypertrophy
Criterion* | Finding | Points |
|---|---|---|
Cornell† | Men: V3 S wave + aVL R wave > 28 mm | N/A |
Women: V3 S wave + aVL R wave > 20 mm | N/A | |
Romhilt-Estes‡ (5 points = definite LVH; 4 points = probable LVH) | R or S wave ≥ 20 mm in any limb lead or S wave in V1 or V2 ≥ 30 mm or R wave in V5 or V6 ≥ 30 mm | 3 |
ST-T changes typical of LVH | — | |
| 1 | |
| 3 | |
Left atrial changes: P terminal wave in V1, amplitude ≥ 1 mm, and duration ≥ 0.04 second | 3 | |
Left axis deviation ≥− 30° | 2 | |
QRS duration ≥ 90 millisecond | 1 | |
Interval between QRS and R-wave peak in V5 or V6 ≥ 0.05 second | 1 | |
Sokolow-Lyon¶ | V1 S wave + V5 or V6 R wave ≥ 35 mm or aVL R wave ≥ 11 mm | N/A |
* Selected criteria sets in widespread use are represented; many other criteria for LVH have been described. | ||
† Casale PN, Devereux RB, Kligfield P, et al. Electrocardiographic detection of left ventricular hypertrophy: development and prospective validation of improved criteria. J Am Coll Cardiol. 1985;6(3):572-580. doi:10.1016/s0735-1097(85)80115-7 | ||
‡ Romhilt DW, Estes EH Jr. A point-score system for the ECG diagnosis of left ventricular hypertrophy. Am Heart J. 1968;75(6):752-758. doi:10.1016/0002-8703(68)90035-5 | ||
¶ SOKOLOW M, LYON TP. The ventricular complex in left ventricular hypertrophy as obtained by unipolar precordial and limb leads. Am Heart J. 1949;37(2):161-186. doi:10.1016/0002-8703(49)90562-1 | ||
ECG = electrocardiography; LVH = left ventricular hypertrophy. | ||
Hancock EW, Deal BJ, Mirvis DM, et al. AHA/ACCF/HRS recommendations for the standardization and interpretation of the electrocardiogram: part V: electrocardiogram changes associated with cardiac chamber hypertrophy: a scientific statement from the American Heart Association Electrocardiography and Arrhythmias Committee, Council on Clinical Cardiology; the American College of Cardiology Foundation; and the Heart Rhythm Society: endorsed by the International Society for Computerized Electrocardiology. Circulation. 2009;119(10):e251-e261. doi:10.1161/CIRCULATIONAHA.108.191097; Peguero JG, Lo Presti S, Perez J, Issa O, Brenes JC, Tolentino A. Electrocardiographic Criteria for the Diagnosis of Left Ventricular Hypertrophy. J Am Coll Cardiol. 2017;69(13):1694-1703. doi:10.1016/j.jacc.2017.01.037 | ||

Standard ECG Components
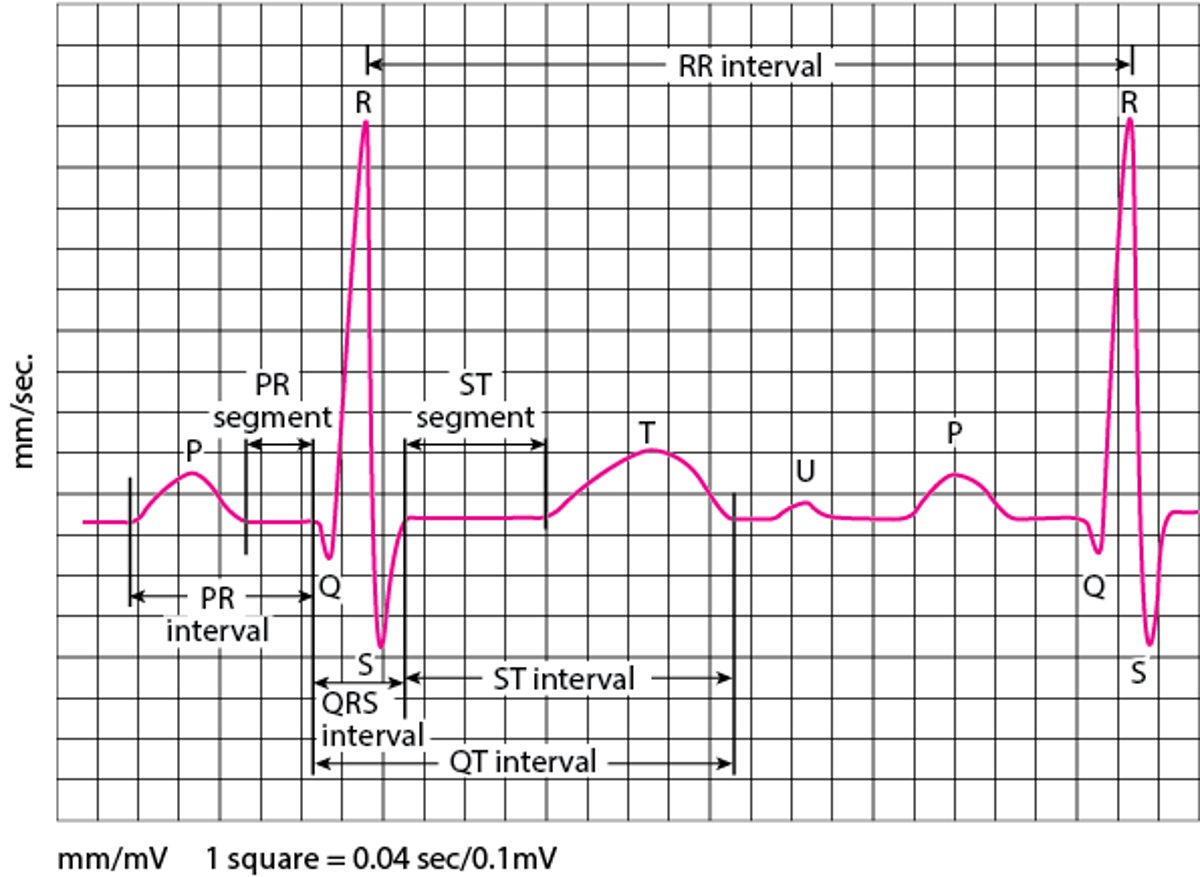
By convention, the ECG tracing is divided into the P wave, PR interval, QRS complex, QT interval, ST segment, T wave, and U wave (see figure ). Normal ECG reference ranges described below are for adults; pediatric ECG reference ranges change with age due to changing heart position and size, a shift from right to left heart dominance over time, and changing baseline heart rates.
Electrocardiography (ECG) waves
P wave = activation (depolarization) of atria. PR interval =time interval between onset of atrial depolarization and onset of ventricular depolarization. QRS complex = depolarization of ventricles, consisting of the Q, R, and S waves. QT interval = time interval between onset of ventricular depolarization and end of ventricular repolarization. R-R interval = time interval between 2 QRS complexes. T wave = ventricular repolarization. ST segment plus T wave (ST-T) = ventricular repolarization. U wave = probably after-depolarization (relaxation) of ventricles. |

P wave
The P wave represents atrial depolarization. It is normally upright in most leads except aVR. It may be biphasic in leads II and V1; the initial component represents right atrial activity, and the second component represents left atrial activity.
An increase in amplitude of either or both components occurs with atrial enlargement. Right atrial enlargement produces a tall, peaked P wave > 2 mm in leads II, III, and aVF (P pulmonale); left atrial enlargement produces a P wave that is broad and double-peaked in lead II (P mitrale). Normally, the P axis is between 0° and 75°.
PR interval
The PR interval is the time between onset of atrial depolarization and onset of ventricular depolarization. Normally, it is 0.10 to 0.20 second; prolongation defines first-degree atrioventricular block.
QRS complex
The QRS complex represents ventricular depolarization.
The Q wave is the initial downward deflection; normal Q waves last < 0.05 second in all leads except V1 to V3, in which any Q wave is considered abnormal, indicating past or current infarction.
The R wave is the first upward deflection; criteria for normal height or size are not absolute, but taller R waves may be caused by ventricular hypertrophy. A second upward deflection in a QRS complex is designated R′.
The S wave is the second downward deflection if there is a Q wave and the first downward deflection if not.
The QRS complex may be R alone, QS (no R), QR (no S), RS (no Q), or RSR′, depending on the ECG lead, vector, and presence of heart disorders.
Normally, the QRS interval is 0.07 to 0.10 second. An interval of 0.10 to 0.11 second is considered incomplete bundle branch block or a nonspecific intraventricular conduction delay, depending on QRS morphology. An interval ≥ 0.12 second is considered complete bundle branch block or an intraventricular conduction delay.
Normally, the QRS axis is 90° to −30°. An axis of −30° to −90° is considered left axis deviation and occurs in left anterior fascicular block (−60°) and inferior myocardial infarction.
An axis of 90° to 180° is considered right axis deviation; it occurs in any condition that increases pulmonary pressures and causes right ventricular hypertrophy (cor pulmonale, acute pulmonary embolism, pulmonary hypertension), and it sometimes occurs in right bundle branch block or left posterior fascicular block.
QT interval
The QT interval is the time between onset of ventricular depolarization and end of ventricular repolarization. The QT interval must be corrected for heart rate using the formula:


where QTc is the corrected QT interval and R-R interval is the time between 2 QRS complexes. All intervals are recorded in seconds. Normal range of QTc in adults is 350 to 450 msec in men and 360 to 460 msec in women. QTc prolongation is strongly implicated in development of torsades de pointe ventricular tachycardia. QTc is often difficult to calculate because the end of the T wave is often unclear or followed by a U wave with which it merges. Numerous medications are either known to prolong the QT interval or are implicated in prolonging it (see CredibleMeds). Congenital long QT syndrome, an inherited arrhythmia syndrome caused by mutations in genes encoding cardiac ion channels, also causes a prolonged QTc.
ST segment
The ST segment represents completed ventricular myocardial depolarization. Normally, it is horizontal along the baseline of the PR (or TP) intervals or slightly off baseline.
ST segment elevation can be caused by:
Early repolarization
Left ventricular hypertrophy
Myocardial stress, ischemia, or infarction
Left ventricular aneurysm
Pericarditis
Hyperkalemia
Hypothermia
Pulmonary embolism
ST segment depression can be caused by:
Hypokalemia
Digoxin
Subendocardial ischemia
Reciprocal changes in acute myocardial infarction
T wave
The T wave reflects ventricular repolarization. It usually takes the same direction as the QRS complex (concordance); opposite polarity (discordance) may indicate past or current infarction. The T wave is usually smooth and rounded but may be of low amplitude in hypokalemia and hypomagnesemia and may be tall and peaked in hyperkalemia, hypocalcemia, and left ventricular hypertrophy.
U wave
The U wave appears commonly in patients who have hypokalemia, hypomagnesemia, or ischemia. It is often present in healthy people.
Specialized ECG Tests
A standard 12-lead ECG represents only a single brief period of cardiac activity; enhanced techniques can provide additional information.
Additional precordial leads
Additional precordial leads are used to help diagnose:
Right ventricular infarction
Posterior wall infarction
Right-sided leads are placed across the right side of the chest to mirror standard left-sided leads. They are labeled V1R to V6R; sometimes only V4R is used, because it is the most sensitive for right ventricular myocardial infarction.
Additional left-sided leads can be placed in the fifth intercostal space, with V7 at the posterior axillary line, V8 at the midscapular line, and V9 at the left border of the spine. These leads are rarely used but may help diagnose a true posterior myocardial infarction.
Both right-sided and posterior leads are also used in pediatric electrocardiography.
Esophageal lead
An esophageal lead is much closer to the atria than surface leads; it is an option when the presence of P waves on a standard recording is uncertain and when detecting atrial electrical activity is important, as when atrial or ventricular origin of wide-complex tachycardia must be differentiated or when atrioventricular dissociation is suspected. An esophageal lead may also be used to monitor intraoperative myocardial ischemia or to detect atrial activity during cardioplegia. The lead is placed by having the patient swallow an electrode, which is then connected to a standard ECG machine, often in the lead II port.
Signal averaging
Signal averaging of QRS waveforms creates a digital composite of several hundred cardiac cycles to detect high-frequency, low-amplitude potentials and microcurrents at the terminal part of the QRS complex. These findings represent areas of slow conduction through abnormal myocardium, indicating increased risk of reentrant ventricular tachycardia.
Signal-averaged ECG is used primarily in diagnosis and risk stratification of arrhythmogenic right ventricular cardiomyopathy and risk stratification in Brugada syndrome (1, 2, 3). However, its use in routine clinical practice is otherwise limited.
Signal averaging of P waves is being studied as a way to identify patients at risk of atrial fibrillation (4).
QT dispersion
QT dispersion (the difference between the longest and shortest QT intervals on a 12-lead ECG) has been proposed as a measure of myocardial repolarization heterogeneity. Increased dispersion (≥ 100 millisecond) can suggest electrically heterogeneous myocardium caused by ischemia or fibrosis, with increased risk of reentrant arrhythmias and sudden death. QT dispersion has not been found to have significant clinical benefit and is not recommended for routine use (2).
Heart rate variability
This measurement reflects the balance between sympathetic and parasympathetic (vagal) input to the heart. Decreased variability suggests decreased vagal input and increased sympathetic input, which predict increased risk of arrhythmias and all-cause mortality (5, 6, 7). The most common measure of variability is the mean of the standard deviations of all normal R-R intervals in a 24-hour ECG recording. Heart rate variability provides useful information about left ventricular dysfunction after myocardial infarction, heart failure, and hypertrophic cardiomyopathy. Most Holter monitors have software that measures and analyzes heart rate variability, but clinical utility is uncertain.
Heart rate variability is also widely measured as a proxy for exercise intensity and recovery, sleep, stress, and overall health in the consumer wearable health and fitness technology market (8). There is some scientific evidence for its use in detecting overtraining and other sources of physical stress. Measurement and reporting are not standardized, and interpretation is challenging.
Holter monitor
Holter monitoring is continuous monitoring and recording of the ECG for 24 hours to 14 days. The Holter monitor is portable, enabling patients to participate in most normal daily activities; it may also be used for patients who are sedentary and hospitalized if automated monitoring is unavailable. Patients are asked to record symptoms and activities so that they may be correlated with events on the monitor. The Holter monitor does not analyze the ECG data in real-time; analysis is done at a later date by a combination of computerized and technician analysis and physician review and interpretation.
Given the short monitoring window, Holter monitors are best suited to detect arrhythmias (as the cause of symptoms) when symptoms occur daily or near-daily, to quantify ectopy burden (eg, premature ventricular contractions), and to assess heart rate control in patients with known arrhythmias (eg, atrial fibrillation).
Event recorder
Event recorders are typically worn for up to 30 days and can detect infrequent rhythm disturbances that 24-hour Holter monitoring may miss. The recorder may operate continuously or also be activated by the patient when symptoms occur. A memory loop enables information to be stored for seconds or minutes before and after activation. The patient can transmit ECG data by telephone or satellite to be read by a physician; some recorders automatically transmit serious events. If patients have serious events (eg, syncope) at intervals of > 30 days, an event recorder may be placed subcutaneously (implantable loop recorder); it can be activated by a small magnet. Battery life for subcutaneous recorders is several years.
Other event monitoring devices
Traditionally, both Holter and event monitors have required electrodes, wires, and a recorder or transmitter. Many other monitoring devices are available as a self-contained in a small water-resistant, wireless, and disposable adhesive device worn on the chest. One type of this device continuously records cardiac rhythms for up to 2 weeks. Another similar device functions as an event recorder; a patient pushes a button on the device when experiencing any potential arrhythmia-related symptoms (eg, palpitations, dizziness) to record stored ECG data 45 seconds before the event plus 15 seconds after the event. However, unlike with event recorders, automated, real-time reporting is not consistently available.
Many event recorders provide some analysis of heart rate and/or ectopy burden; similarly, some longer-term Holter monitors can serve as a shorter-term event monitor if patients are instructed to record symptoms carefully.
Some ambulatory monitors are continuously monitored via a remote monitoring station ("mobile telemetry").
Smartwatches, wearable fitness and health technology, and other consumer devices with ECG capability
Many smartwatches, wearable fitness and health devices, or other devices that connect with a smartphone can record ECG measurements (8). Such devices are available directly to consumers. In many cases, ECG measurements from these devices may be saved and printed or transmitted. Wearable and other devices have the potential to detect arrhythmias, particularly atrial fibrillation, in real time, and their usefulness in this rapidly expanding area is under active investigation (9).
References
1. Al-Khatib SM, Stevenson WG, Ackerman MJ, et al. 2017 AHA/ACC/HRS guideline for management of patients with ventricular arrhythmias and the prevention of sudden cardiac death: A Report of the American College of Cardiology/American Heart Association Task Force on Clinical Practice Guidelines and the Heart Rhythm Society. Heart Rhythm. 2018;15(10):e73-e189. doi:10.1016/j.hrthm.2017.10.036
2. Nielsen JC, Lin YJ, de Oliveira Figueiredo MJ, et al. European Heart Rhythm Association (EHRA)/Heart Rhythm Society (HRS)/Asia Pacific Heart Rhythm Society (APHRS)/Latin American Heart Rhythm Society (LAHRS) expert consensus on risk assessment in cardiac arrhythmias: use the right tool for the right outcome, in the right population. Europace. 2020;22(8):1147-1148. doi:10.1093/europace/euaa065
3. Pearman CM, Lee D, Davies B, et al. Incremental value of the signal-averaged ECG for diagnosing arrhythmogenic cardiomyopathy. Heart Rhythm. 2023;20(2):224-230. doi:10.1016/j.hrthm.2022.10.005
4. Fuster V, Rydén LE, Cannom DS, et al. 2011 ACCF/AHA/HRS focused updates incorporated into the ACC/AHA/ESC 2006 Guidelines for the management of patients with atrial fibrillation: a report of the American College of Cardiology Foundation/American Heart Association Task Force on Practice Guidelines developed in partnership with the European Society of Cardiology and in collaboration with the European Heart Rhythm Association and the Heart Rhythm Society. J Am Coll Cardiol. 2011;57(11):e101-e198. doi:10.1016/j.jacc.2010.09.013
5. Goldberger JJ, Cain ME, Hohnloser SH, et al. American Heart Association/American College of Cardiology Foundation/Heart Rhythm Society Scientific Statement on Noninvasive Risk Stratification Techniques for Identifying Patients at Risk for Sudden Cardiac Death. A scientific statement from the American Heart Association Council on Clinical Cardiology Committee on Electrocardiography and Arrhythmias and Council on Epidemiology and Prevention. J Am Coll Cardiol. 2008;52(14):1179-1199. doi:10.1016/j.jacc.2008.05.003
6. Jarczok MN, Weimer K, Braun C, et al. Heart rate variability in the prediction of mortality: A systematic review and meta-analysis of healthy and patient populations. Neurosci Biobehav Rev. 2022;143:104907. doi:10.1016/j.neubiorev.2022.104907
7. Steinberg JS, Varma N, Cygankiewicz I, et al. 2017 ISHNE-HRS expert consensus statement on ambulatory ECG and external cardiac monitoring/telemetry. Ann Noninvasive Electrocardiol. 2017;22(3):e12447. doi:10.1111/anec.12447
8. Petek BJ, Al-Alusi MA, Moulson N, et al. Consumer Wearable Health and Fitness Technology in Cardiovascular Medicine: JACC State-of-the-Art Review. J Am Coll Cardiol. 2023;82(3):245-264. doi:10.1016/j.jacc.2023.04.054
9. Writing Committee, Spooner MT, Messé SR, et al. 2024 ACC Expert Consensus Decision Pathway on Practical Approaches for Arrhythmia Monitoring After Stroke: A Report of the American College of Cardiology Solution Set Oversight Committee. J Am Coll Cardiol. 2025;85(6):657-681. doi:10.1016/j.jacc.2024.10.100
More Information
The following English-language resources may be useful. Please note that The Manual is not responsible for the content of these resources.
University of Utah ECG Learning Center: Provides an interactive tutorial on clinical electrocardiography
CredibleMeds QTDrugs List: Provides information on medications that are known or suspected to increase the risk of ventricular arrhythmias
Drug Information for the Topic