Nutrition is the science of food and its relationship to health. Nutrients are chemicals in foods that are used by the body for growth, maintenance, and energy.
Nutrients that cannot be synthesized by the body and thus must be derived from the diet are considered essential. They include
Nutrients that the body can synthesize from other compounds, although they may also be derived from the diet, are considered nonessential. However, under certain conditions, such as illness or stress, synthesis of normally nonessential nutrients may be compromised, thus making them essential. These conditionally essential nutrients must then be supplied by the diet.
Macronutrients (carbohydrates, protein, and fat) are required by the body in relatively large amounts; micronutrients (vitamins and some trace minerals) are needed in minute amounts.
Lack of nutrients can result in undernutrition, which can lead to deficiency syndromes (eg, kwashiorkor, pellagra). Excess intake of macronutrients can lead to obesity and related disorders; excess intake of micronutrients can be toxic. Also, the balance of various types of nutrients, such as how much unsaturated versus saturated fat is consumed, can influence the development of disorders.
Macronutrients
Macronutrients constitute the bulk of the diet and supply energy and many essential nutrients. Carbohydrates, proteins (including essential amino acids), fats (including essential fatty acids), macrominerals, and water are macronutrients. Carbohydrates, fats, and proteins are interchangeable as sources of energy; fats yield 9 kcal/g (37.8 kJ/g); proteins and carbohydrates yield 4 kcal/g (16.8 kJ/g).
Carbohydrates
Dietary carbohydrates are broken down into glucose and other monosaccharides. Carbohydrates increase blood glucose levels, supplying energy.
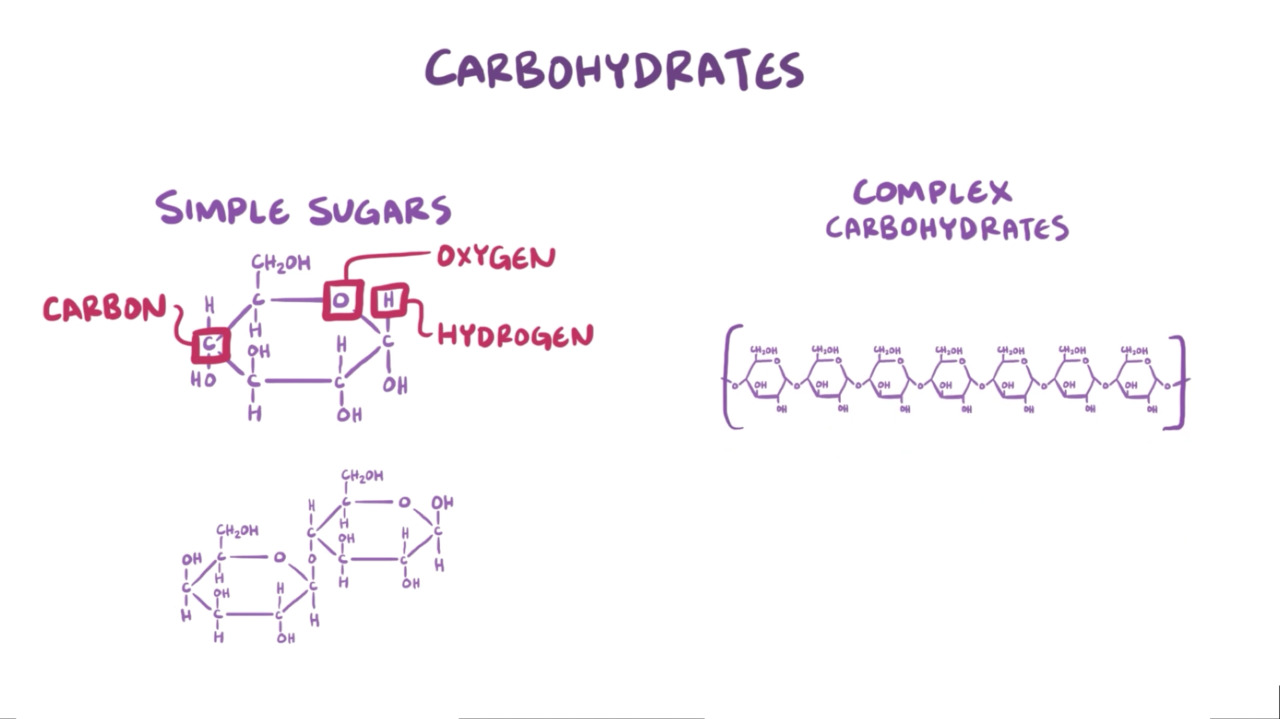
Simple carbohydrates are composed of small molecules, generally monosaccharides or disaccharides, which increase blood glucose levels rapidly.
Complex carbohydrates are composed of three or more monosaccharides bonded together, which are then broken down into monosaccharides during digestion. Complex carbohydrates increase blood glucose levels more slowly but for a longer time.
Glucose and sucrose are simple carbohydrates; starches, fiber, and glycogen are complex carbohydrates.
The glycemic index is a way of classifying foods based on how rapidly consumption of available carbohydrates increases plasma glucose levels relative to a standard. Values range from 1 (the slowest increase) to 100 (the fastest increase, equivalent to pure glucose—see table Glycemic Index of Some Foods). However, the actual rate of increase also depends on what foods are consumed with the carbohydrate.
Carbohydrates with a high glycemic index may increase plasma glucose to high levels rapidly. It is hypothesized that as a result, insulin levels increase, inducing hypoglycemia and hunger, which tends to lead to consumption of excess calories and weight gain. Carbohydrates with a low glycemic index increase plasma glucose levels slowly, resulting in lower postprandial insulin levels and less hunger, which probably makes consumption of excess calories less likely. These effects are predicted to result in a more favorable lipid profile and a decreased risk of obesity, diabetes mellitus, and complications of diabetes if present.
Fiber
Fiber is a complex carbohydrate and occurs in various forms (eg, cellulose, hemicellulose, pectin, gums). Dietary fiber can be soluble or insoluble. Insoluble fiber increases gastrointestinal motility, prevents constipation, increases fecal bulk, and helps control diverticular disease. Insoluble fiber is thought to accelerate the elimination of cancer-causing substances produced by bacteria in the large intestine. Epidemiologic evidence suggests an association between colon cancer and low fiber intake and a beneficial effect of fiber in patients with functional bowel disorders, Crohn disease, obesity, or hemorrhoids. Soluble fiber (present in fruits, vegetables, oats, barley, and legumes) reduces the postprandial increase in blood glucose and insulin and can reduce cholesterol levels.
The typical Western diet is low in fiber (about 12 to 17 g/day) because of a high intake of highly refined wheat flour and a low intake of fruits and vegetables. Increasing fiber intake to about 30 g/day by consuming more vegetables, fruits, and high-fiber cereals and grains is generally recommended. However, very high fiber intake may reduce absorption of certain minerals.
Proteins
Proteins are complex organic molecules that contain carbon, hydrogen, oxygen, and nitrogen. Proteins are required for tissue maintenance, replacement, function, and growth. Specific proteins act as enzymes, make up certain hormones, and play an important role in maintaining fluid balance. If the body is not getting enough calories from dietary sources or tissue stores (particularly of fat), protein may be used for energy. Dietary proteins are broken down into peptides and amino acids.
As the body uses dietary protein for tissue production, there is a net gain of protein (positive nitrogen balance). During catabolic states (eg, starvation, infections, burns), more protein may be used (because body tissues are broken down) than is absorbed, resulting in a net loss of protein (negative nitrogen balance). Nitrogen balance is best determined by subtracting the amount of nitrogen excreted in urine and feces from the amount of nitrogen consumed.
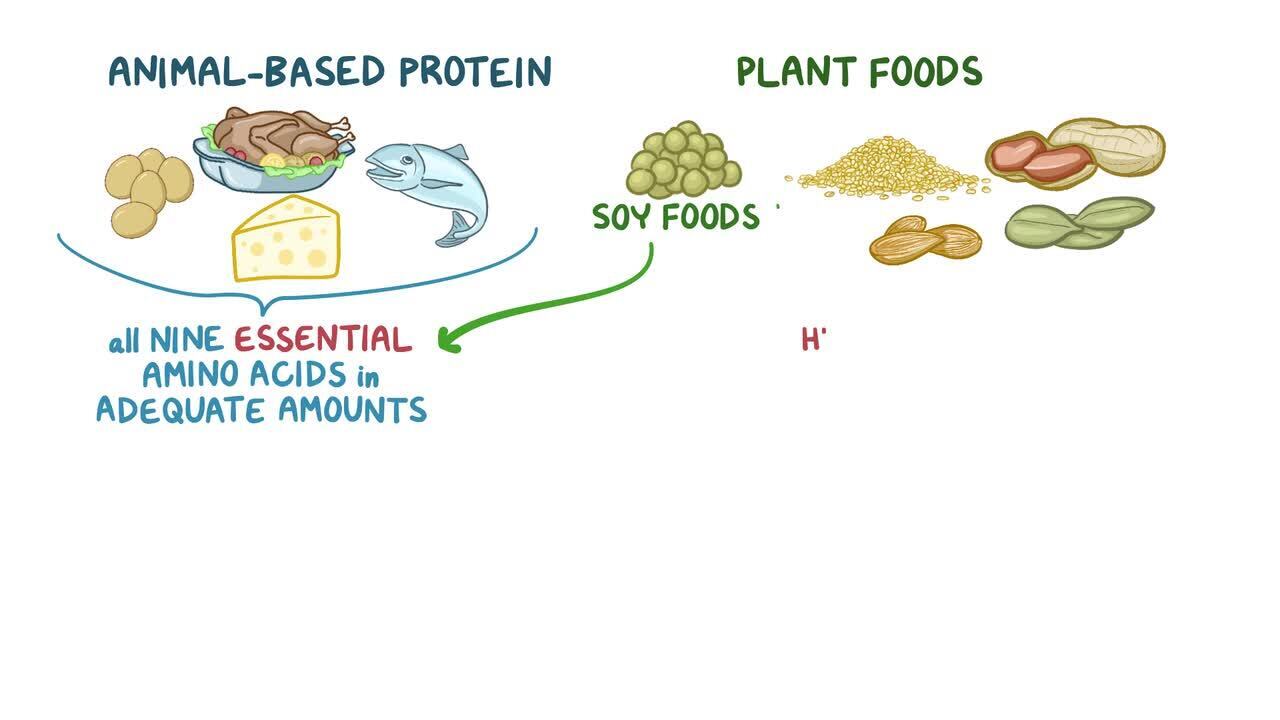
Of the 20 amino acids, 9 are essential amino acids (EAAs); they cannot be synthesized and must be obtained from the diet. All people require 8 EAAs; infants also require histidine.
The weight-adjusted requirement for dietary protein correlates with growth rate, which decreases from infancy until adulthood. The daily dietary protein requirement decreases from 2.2 g/kg in 3-month-old infants to 1.2 g/kg in 5-year-old children and to 0.8 g/kg in adults. Protein requirements correspond to EAA requirements. Also, protein requirements are higher among certain patients. For example, protein needs increase dramatically during pregnancy and lactation and during periods of rapid growth and recovery from illness. Protein requirements also increase with aging (1, 2). Adults trying to increase muscle mass need extra protein (eg, 1.4 to 2.0 g/kg/day) beyond average daily essential amino acid requirements (3).
The amino acid composition of protein varies widely. Biological value (BV) reflects the similarity in amino acid composition of protein to that of animal tissues; thus, BV indicates what percentage of a dietary protein provides EAAs for the body:
A perfect match is egg protein, with a value of 100.
Animal proteins in milk and meat have a high BV (~90).
Proteins in cereal and vegetables have a lower BV (~40)
Some derived proteins (eg, gelatin) have a BV of 0.
The extent to which dietary proteins supply each other's missing amino acids (complementarity) determines the overall BV of the diet. The recommended daily allowances (RDA) for protein assumes that the average mixed diet has a BV of 70.
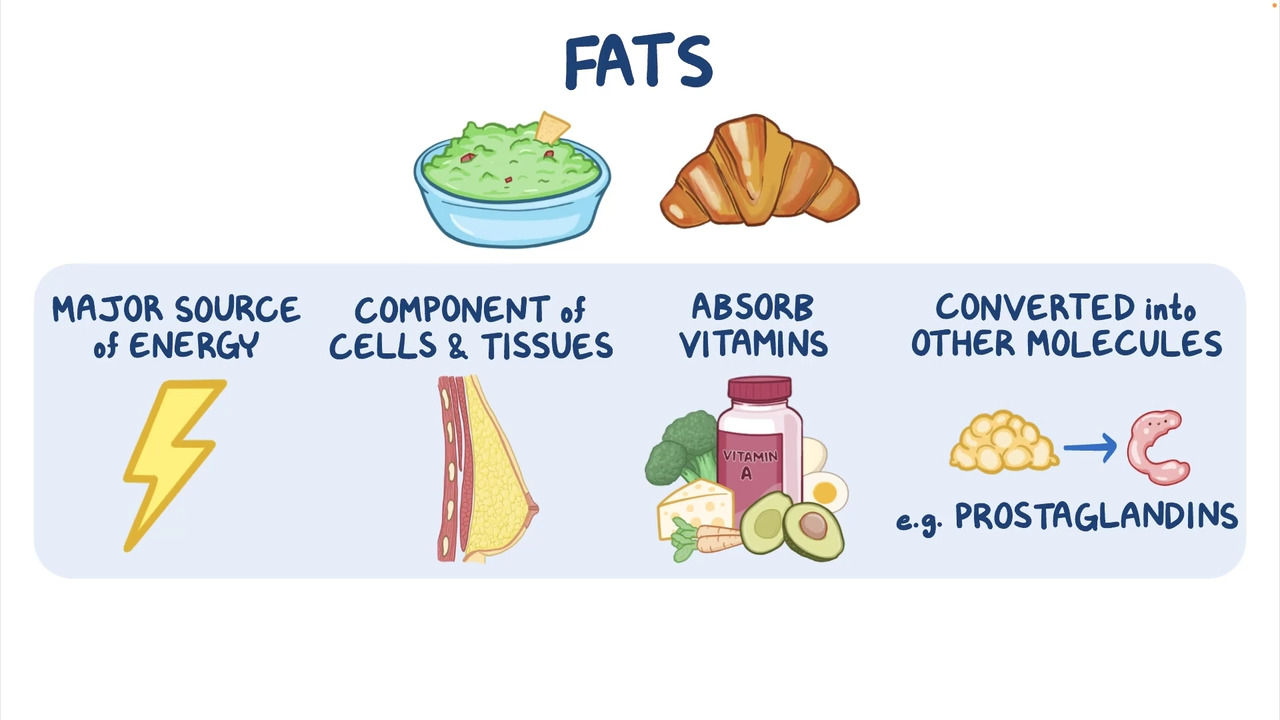
Fats
Fats are broken down into fatty acids and glycerol. Fats are required for tissue growth and hormone production. Saturated fatty acids, common in animal fats, tend to be solid at room temperature. Except for palm and coconut oils, fats derived from plants tend to be liquid at room temperature; these fats contain high levels of monounsaturated fatty acids or polyunsaturated fatty acids (PUFAs).
Partial hydrogenation of unsaturated fatty acids (as occurs during food manufacturing) produces trans fatty acids, which are solid or semisolid at room temperature. Until recently, in the US, the main dietary source of trans fatty acids was partially hydrogenated vegetable oils, used in manufacturing certain foods (eg, cookies, crackers, chips) to prolong shelf-life. However, in 2015, the U.S. Food and Drug Administration (FDA) removed partially hydrogenated oils from its Generally Recognized as Safe category based on extensive research that showed that trans fatty acids elevate LDL cholesterol, lower HDL cholesterol, and increase the risk of coronary artery disease. Since June 2018, artificial trans fats have been banned in the US.
Essential fatty acids (EFAs) are
Linoleic acid, an omega-6 (n-6) fatty acid
Linolenic acid, an omega-3 (n-3) fatty acid
Other omega-6 acids (eg, arachidonic acid) and other omega-3 fatty acids (eg, eicosapentaenoic acid, docosahexaenoic acid) are required by the body but can be synthesized from EFAs.
EFAs are needed for the formation of various eicosanoids (biologically active lipids), including prostaglandins, thromboxanes, prostacyclins, and leukotrienes. Consumption of omega-3 fatty acids may decrease the risk of coronary artery disease.
Requirements for EFAs vary by age. The adequate intake for alpha-linolenic acid is 1.6 g/day for men and 1.1 g/day for women. The adequate intake for linoleic acid is 17 g/day for men and 12 g/day for women between 19 and 50 years of age. (Adequate intake is defined as the average nutrient intake consumed daily by a population of healthy people.) Vegetable oils provide linoleic acid and linolenic acid. Oils made from safflower, sunflower, corn, soy, primrose, pumpkin, and wheat germ provide large amounts of linoleic acid. Marine fish oils and oils made from flaxseeds, pumpkin, soy, and canola provide large amounts of linolenic acid. Marine fish oils also provide some other omega-3 fatty acids in large amounts. The recommended intakes of EFAs can be met with 2 to 3 tablespoons of vegetable fat daily or by consuming about 3 to 3.5 ounces of cooked fatty fish such as salmon twice a week.
Macrominerals
Sodium, chloride, potassium, calcium, phosphate, and magnesium are required in relatively large amounts per day (see tables Macrominerals, Recommended Dietary Reference Intakes, and Guidelines for Daily Intake).
Water
Water is considered a macronutrient because it is required in amounts of 1 mL/kcal (0.24 mL/kJ) of energy expended, or about 2500 mL/day. Needs vary with fever, physical activity, and changes in climate and humidity. The adequate intake for total water is 2.7 L for women and 3.7 L for men.
Macronutrients references
1. Bauer J, Biolo G, Cederholm T, et al: Evidence-based recommendations for optimal dietary protein intake in older people: a position paper from the PROT-AGE Study Group. J Am Med Dir Assoc 14(8):542-559, 2013. doi:10.1016/j.jamda.2013.05.021
2. Baum JI, Kim IY, Wolfe RR: Protein consumption and the elderly: What is the optimal level of intake? Nutrients 8(6):359, 2016. doi:10.3390/nu8060359
3. Campbell B, Kreider RB, Ziegenfuss T, et al: International Society of Sports Nutrition position stand: protein and exercise. J Int Soc Sports Nutr 4:8, 2007. doi:10.1186/1550-2783-4-8
Micronutrients
Vitamins and minerals required in minute amounts (trace minerals) are micronutrients.
Water-soluble vitamins, folate, niacin, , (vitamin B2), thiamin (vitamin B1), vitamin B6vitamin B12 (cobalamin).
Fat-soluble vitamins are vitamins A (retinol), D (cholecalciferol and ergocalciferol), E (alpha-tocopherol), and K (phylloquinone and menaquinone).
Only vitamins A, E, and B12 are stored to any significant extent in the body; the other vitamins must be consumed regularly to maintain tissue health.
Essential trace minerals include , , iodine, iron, , molybdenum, , and zinc
Other minerals (eg, aluminum, arsenic, boron, cobalt, fluoride, nickel, silicon, vanadium) have not been proved essential for people. Fluoride, although not essential, helps prevent tooth decay by forming a compound with calcium (calcium fluoride [CaF2]), which stabilizes the mineral matrix in teeth.
Other Dietary Substances
The daily human diet typically contains as many as 100,000 chemicals (eg, coffee contains 1000). Of these, only 300 are nutrients, only some of which are essential. However, many nonnutrients in foods are useful. For example, food additives (eg, preservatives, emulsifiers, antioxidants, stabilizers) improve the production and stability of foods. Trace components (eg, spices, flavors, odors, colors, phytochemicals, many other natural products) improve appearance and taste.
Processed Foods, Organic Foods, and Bioengineered or Genetically Modified Foods
Processed foods
The US Department of Agriculture (USDA) defines a processed food as any raw agricultural commodity that has been subject to washing, cleaning, milling, cutting, chopping, heating, pasteurising, blanching, cooking, canning, freezing, drying, dehydrating, mixing, packaging, or any other procedure that alters the food from its natural state. Based on this definition, virtually all food is processed to some degree. Some modern food processing, however, strips nutrients from foods. For example, milling removes bran and germ, and thus fiber, iron, and many B vitamins from grains. Processing also often adds additives such as preservatives (eg, benzoates, sorbates, nitrites, sulfites, and citric acid); artificial colors, flavors, and sweeteners; stabilizers; emulsifiers; and synthetic vitamins and minerals and other additives including salt, monosodium glutamate (MSG), sugar, fats, and refined oils. Some food additives can adversely affect children in particular.
Ultra-processed foods (eg, sweets, salty snacks, sugar-sweetened beverages, ready-to-eat meals, and fast food) are increasingly common and make up nearly half of the food supply in many countries. They are made from inexpensive ingredients (including unhealthful fats, refined grains and starches, and added sugar and salt) that are often combined with food additives (including artificial colors, flavors, and preservatives) to make them inexpensive and exceptionally tasty and to prolong shelf life. Most contain little to no whole foods. These foods promote overeating and weight gain and supply a relative dearth of valuable nutrients, increasing risks of insulin resistance and possibly other disorders (eg, coronary artery disease, depression, irritable bowel syndrome, cancer, and even early death).
Organic foods
To be labeled USDA-certified organic, organic foods must be grown and processed according to federal guidelines that address many factors, including soil quality, animal-raising practices, pest and weed control, and the use of additives. For example, for meat to be labeled organic, the animals must be raised in conditions that accommodate their natural behaviors (such as the ability to graze in a pasture), must be fed 100% organic feed and forage, and must not be given antibiotics or hormones. To be labeled with the USDA organic seal, a product must contain 95% organic ingredients.
Although the certainty and extent of health benefits attributed to foods being organic remain unknown, the absence of antibiotics helps prevent antibiotic resistance. Synthetic pesticides may also increase risks of autism, attention-deficit/hyperactivity disorder (ADHD) and impaired cognitive skills in children. One strategy to help contain the increased costs of organic foods is to consider the Environmental Working Group's (EWG) annual lists of pesticide levels that list the dirty dozen (produce that is contaminated with more pesticides than other crops) and the clean fifteen (produce that has the lowest amounts of pesticide residues).
Bioengineered or genetically modified foods
Bioengineered or genetically modified foods are foods containing genetically modified organisms (GMOs). According to the World Health Organization (WHO), these foods contain DNA that has been modified through laboratory techniques and that cannot be created through conventional breeding or found in nature. Genetically modified foods have existed in the US food supply since the early 1990s, and their safety in humans and animals is overseen by the U.S. Food and Drug Administration (FDA), the Environmental Protection Agency (EPA), and the USDA.
Beginning in January 2022, foods require labeling that indicates whether they are a bioengineered food. These foods are often common ingredients and may be difficult to identify.
Although consumption of bioengineered foods poses no risk to human health, food safety advocacy groups have raised concerns such as development of allergies (if the transferred DNA was taken from an allergenic food) and antibiotic resistance resulting from the consumption of herbicide-resistant crops that could theoretically transfer modified antibiotic-resistant genes to the human digestive tract. The WHO has stated that risk of such antibiotic resistance is very small, but not insignificant.
More Information
US Department of Health and Human Services and US Department of Agriculture: Dietary Guidelines for Americans, 2020-2025